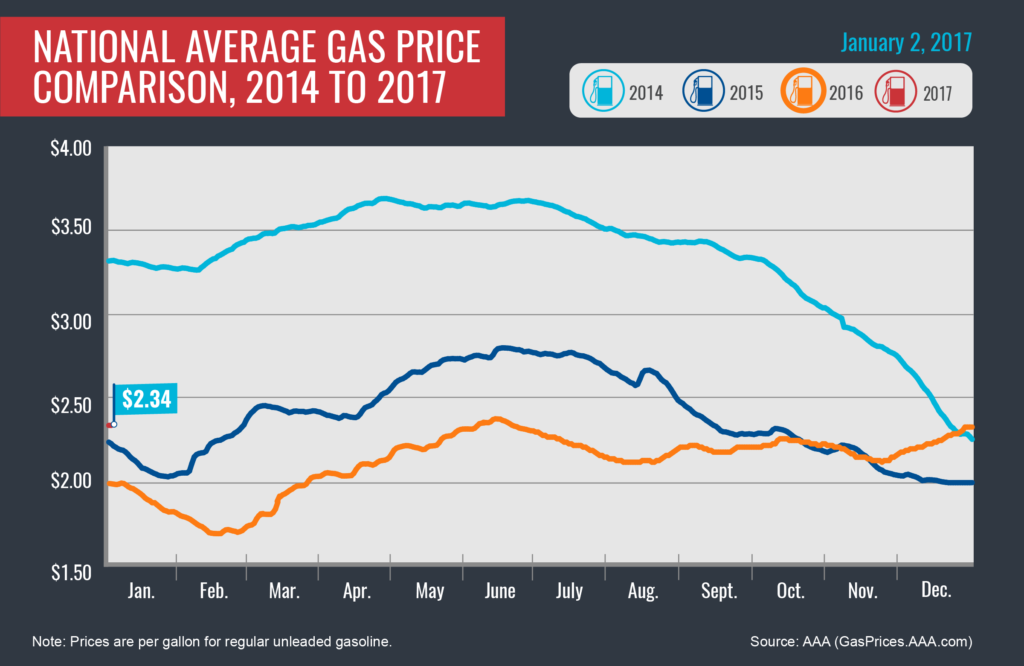
At $2.29 per gallon on New Year’s Day, 2017 kicked off with a $0.29 hike over New Year’s Day 2016. And much ado was made when, just last week the national average reached the highest it’s been since June 2016, at $2.37.
Regardless of the recent upward trend, we are still paying significantly less than just three years ago, when on New Year’s Day 2014 it was at $3.29. And remarkably less than in June 2008, when gas prices soared over $4.00 per gallon, hitting an all-time high of $4.11 that year in July.
Check out this chart published by AAA earlier this month, comparing 2014 prices to today.
So, what do the steadily increasing prices mean? Are we on track to hit more record highs? How will this impact our economy?
According to estimations recently released by the U.S. Energy Information Administration (EIA), the first to release expectations that include 2018, the future looks bright — with a 2018 estimated average of $2.41, just under the 2015 average of $2.43.
Exactly how future gas prices will impact the economy is tough to say. I don’t have an economy background, nor do I have a crystal ball, so I would be remiss to even guess.
What I do know is fuel economy in most vehicles is improving. The Corporate Average Fuel Economy (CAFE) standards that went into effect in 2012 have manufacturer’s working overtime to meet the 2025 requirement of a 54.5 mpg fleet-wide average. Take, for example, the following:
| Model year 2008 | Max highway mpg | Model year 2016 | Max highway mpg | |
| 2008 Chrysler Sebring, 2.4L, 4 cylinder, automatic, 4 speed | 30* | vs. | 2016 Chrysler 200, 2.4L, 4 cylinder, automatic, 9 speed | 36* |
| 2008 Dodge Charger, 2.7L, 6 cylinder, automatic, 4 speed | 26* | vs. | 2016 Dodge Charger, 3.6L, 6 cylinder, automatic, 8 speed | 30* |
| 2008 Jeep® Grand Cherokee 2WD, 3.7L, 6 cylinder, automatic, 5 speed | 20* | vs. | 2016 Jeep Grand Cherokee 2WD, 3.6L, 6 cylinder, automatic, 8 speed | 26* |
| 2008 Dodge Ram 1500 2WD, 3.7L, 6 cylinder, automatic, 4 speed | 19* | vs. | 2016 Ram 1500 2WD, 3.6L, 6 cylinder, automatic, 8 speed | 25* |
*Estimated mpg calculated using side-by-side comparison calculator on FuelEcomony.gov
While the raw numbers may not be overwhelmingly convincing, they represent as much as a 25 percent increase in fuel efficiency in the last six years. If, over the next six years, these same vehicles were to achieve another 25 percent gain, the average highway mpg of these four vehicles will be 36.6 – a staggering difference from the 2008 average of 23.8.
Is this enough to reach the CAFE requirement of 54.5 mpg by 2025? Good question and not one I can answer.
Here’s what I do know:
- The EIA estimates gas prices will increase about 12 percent from 2016 to 2018.
- If the fuel efficiency of the 2016 vehicles above were to increase at the same rate (an average of 32.8 mpg), we would be getting an average of 9 mpg better than we were in the same or similar 2008 models.
- In 2008 the average gas price was 35.6 percent MORE ($3.27 per gallon) than we’re expected to pay next year.
So, overall, we’ll be paying less for gas while achieving better fuel economy?
Now THAT sounds like a plan.
I hate writing about myself. You want me to write about a car. Definitely. Auto finance? Now you’re talking! Me? Snoozefest. But since I have all this space just begging to be filled, I’m going to give this a shot. The auto industry started calling my name way back in 2001. I cut my teeth…
View more articles by Linda Sherman